Free Access
Fig. 7
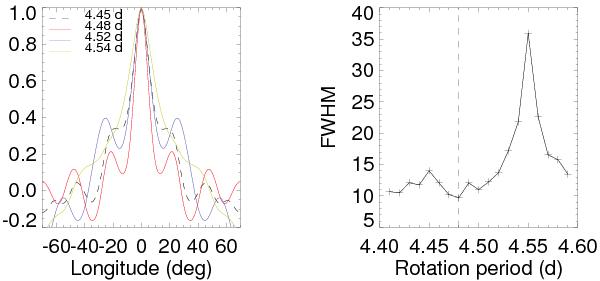
Left: auto-correlation function of the spot flux deficit vs. longitude for four different stellar rotation periods as indicated by the different curves. Right: width of the main peak at half the maximum value (FWHM) of the auto-correlation function versus stellar rotation period.
Current usage metrics show cumulative count of Article Views (full-text article views including HTML views, PDF and ePub downloads, according to the available data) and Abstracts Views on Vision4Press platform.
Data correspond to usage on the plateform after 2015. The current usage metrics is available 48-96 hours after online publication and is updated daily on week days.
Initial download of the metrics may take a while.