Free Access
Fig. 4
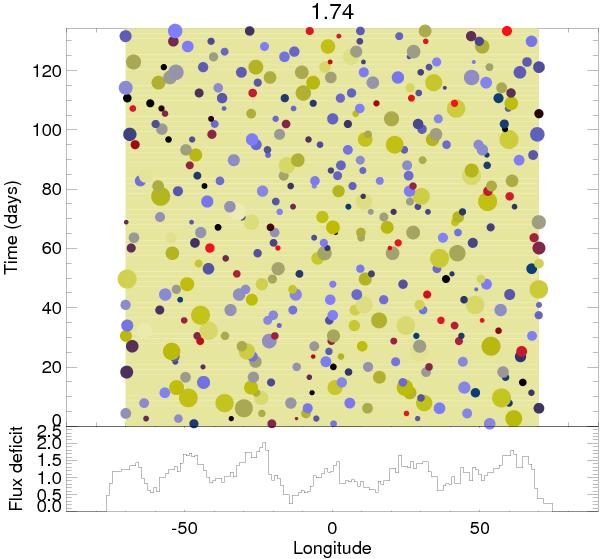
Top: diagram of the spot longitude, size, and intensity for each transit. Darker spot are pictured in darker shades of grey. Bottom: spots flux deficit integrated in time as a function of spot longitude.
Current usage metrics show cumulative count of Article Views (full-text article views including HTML views, PDF and ePub downloads, according to the available data) and Abstracts Views on Vision4Press platform.
Data correspond to usage on the plateform after 2015. The current usage metrics is available 48-96 hours after online publication and is updated daily on week days.
Initial download of the metrics may take a while.