Free Access
Fig. 3
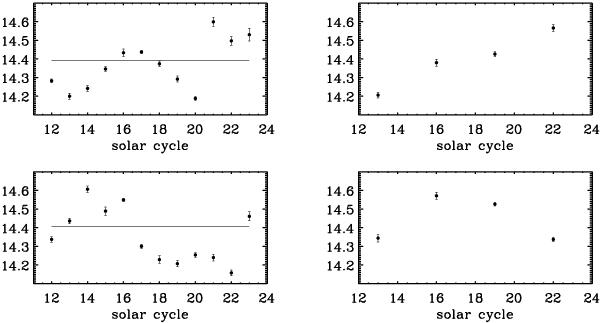
Values of Ω0 using all sunspots for (left panels) individual cycles and (right panels) three-cycle intervals. The upper (lower) panels are for the northern (southern) hemisphere. The horizontal lines depict the best-fit value of Ω0 for the whole interval.
Current usage metrics show cumulative count of Article Views (full-text article views including HTML views, PDF and ePub downloads, according to the available data) and Abstracts Views on Vision4Press platform.
Data correspond to usage on the plateform after 2015. The current usage metrics is available 48-96 hours after online publication and is updated daily on week days.
Initial download of the metrics may take a while.