Fig. 6
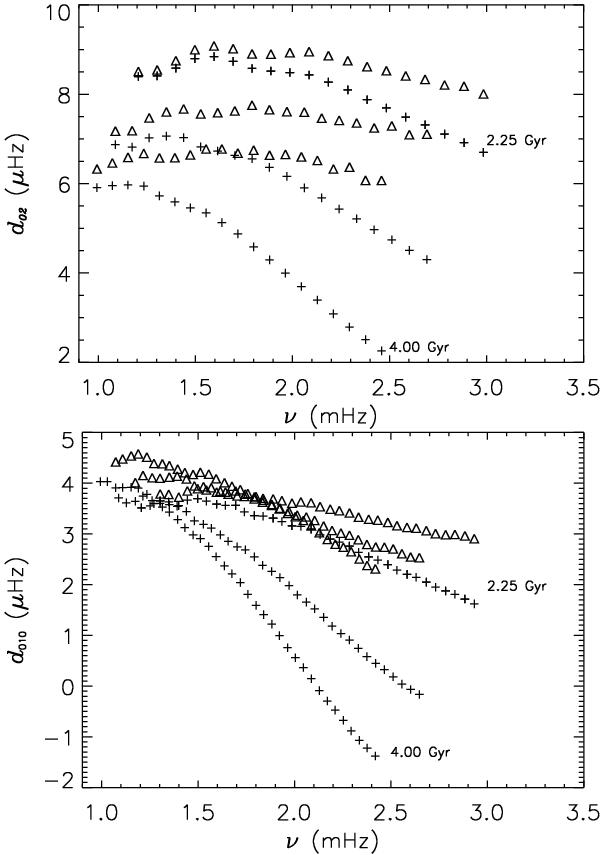
Small separations, d02 (upper panel) and d010 (lower panel), shown as function of frequency, for the same three models as in Fig. 3. We note that d010 equals either d01 or d10, depending on whether the frequency against which it is plotted corresponds to a mode of l = 0 or l = 1, respectively. Crosses show these frequency combinations when derived from the eigenfrequencies of the original model, while open triangles show the same quantities when the perturbation to the frequencies of l = 0 modes due to the sharp structural variation at the edge of the core is subtracted prior to the calculation of the frequency differences.
Current usage metrics show cumulative count of Article Views (full-text article views including HTML views, PDF and ePub downloads, according to the available data) and Abstracts Views on Vision4Press platform.
Data correspond to usage on the plateform after 2015. The current usage metrics is available 48-96 hours after online publication and is updated daily on week days.
Initial download of the metrics may take a while.