Fig. 9
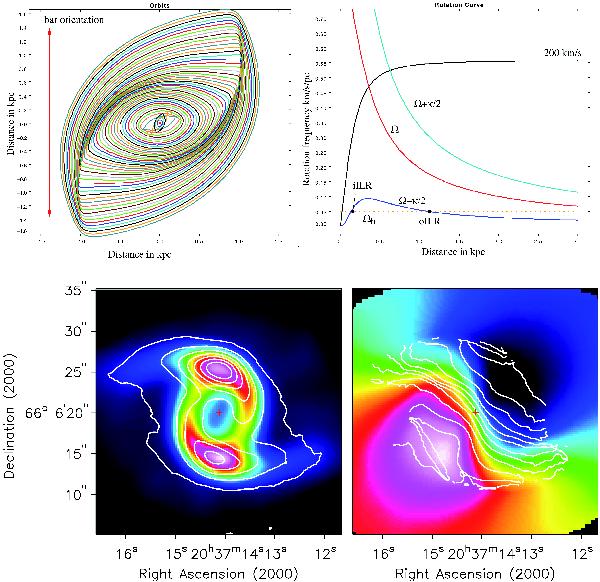
Top, left: deprojected orbit pattern in the inner 3.0 kpc of the bar model. Top, right: resonance diagram. The rotation frequency Ω (red),  (blue),
  (cyan) and the bar pattern speed (yellow dashed). The iILR at 160 pc, oILR at 1150 pc and CR at 4000 pc (outside the displayed range) are indicated with black dots. Overlayed is the rotation curve, which approaches 200 km s-1. The vertical dashed line indicates the outer edge of the models radial mass distribution. Bottom, left: integrated emission of the bar model with contours of CO(1−0) intensity map overlaid. The model emission has been computed at the CO(1−0) resolution. Contours run from 5σ in steps of 20σ (1σ = 0.025 Jy beam-1 km s-1). The red cross indicates the position of the center. Bottom, right: velocity field of the bar potential model with contours of the CO(1−0) velocity field. Contours run from –200 to 200 km s-1 in 25 km s-1 steps.
Current usage metrics show cumulative count of Article Views (full-text article views including HTML views, PDF and ePub downloads, according to the available data) and Abstracts Views on Vision4Press platform.
Data correspond to usage on the plateform after 2015. The current usage metrics is available 48-96 hours after online publication and is updated daily on week days.
Initial download of the metrics may take a while.