Free Access
Fig. 8
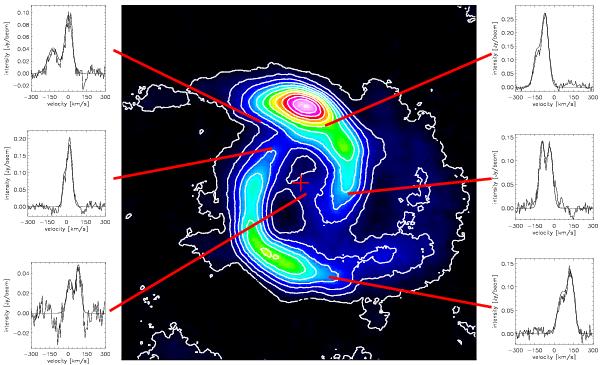
Six example spectra from the robustly weighted CO(2−1) data cube where we fitted a double Gaussian to the velocity axis. The location of each spectrum is indicated with red lines in the intensity map (middle; same area as Fig. 1 bottom, left panel).
Current usage metrics show cumulative count of Article Views (full-text article views including HTML views, PDF and ePub downloads, according to the available data) and Abstracts Views on Vision4Press platform.
Data correspond to usage on the plateform after 2015. The current usage metrics is available 48-96 hours after online publication and is updated daily on week days.
Initial download of the metrics may take a while.