Fig. A.1
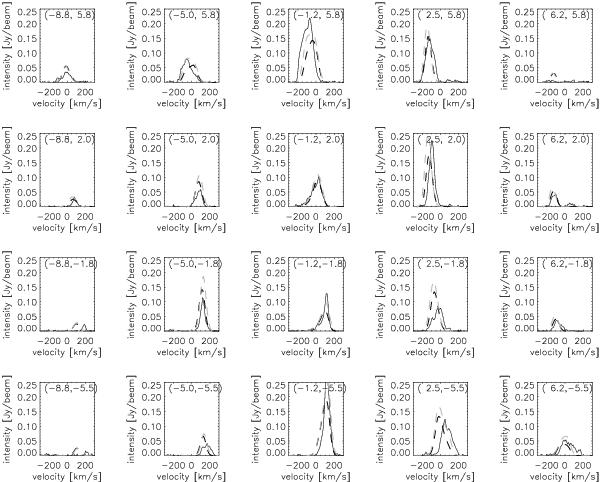
CO(1−0) emission spectra at different positions in the observed data cube (solid line), the best model cube (black dashed line) and a rejected model cube (grey dashed line). The spatial positions in the galaxy for each spectrum, in arcseconds, are given in the subpanels. The model shows a good agreement with the observations. The positions (–1.2, 5.8) and (–1.2, –5.5) correspond to the “twin peaks” described in Sect. 3.1
Current usage metrics show cumulative count of Article Views (full-text article views including HTML views, PDF and ePub downloads, according to the available data) and Abstracts Views on Vision4Press platform.
Data correspond to usage on the plateform after 2015. The current usage metrics is available 48-96 hours after online publication and is updated daily on week days.
Initial download of the metrics may take a while.