Fig. 6
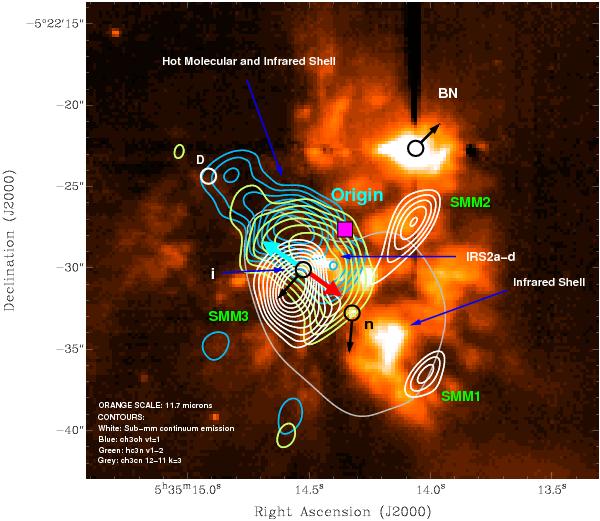
Gemini 11.7 μm continuum image (orange) from Smith et al. (2005) overlaid with SMA maps of the submillimeter continuum emission (faint white contours), the CH3OH(74,3–64,3) A− (νt = 1) and HC3N(37 − 36)(ν7 = 1) integrated emission (blue and green contours, respectively) and the rotational integrated emission of CH3CN(123–113) (single grey contour) toward the Orion KL region. The white contours are from 40% to 90% with steps of 5% of the peak of the continuum emission (4.5 Jy beam-1). The blue contours are from 30% to 90% with steps of 10% of the peak of the line emission, 37 Jy beam-1 km s-1. The integrated velocity range of the CH3OH(74,3–64,3) A− (νt = 2) is from − 5 to + 15 km s-1. The green contours are from 25% to 90% with steps of 12% of the peak of the line emission (170 Jy beam-1 km s-1). The integrated velocity range of HC3N(37 − 36)(ν7 = 1) is from − 12 to + 19 km s-1. The single grey contour is 34% of the peak of the line emission (586 Jy beam-1 km s-1). The integrated velocity range of CH3CN(123–113) is from − 10 to + 26 km s-1. Black circles and pink square as in previous figures. The blue and red arrows at the position of source I show the approximate orientation of the thermal and SiO maser outflow emanating from this object (Plambeck et al. 2009; Matthews et al. 2010). The white open circle marks the position of the radio source D (Zapata et al. 2004; Gómez et al. 2005).
Current usage metrics show cumulative count of Article Views (full-text article views including HTML views, PDF and ePub downloads, according to the available data) and Abstracts Views on Vision4Press platform.
Data correspond to usage on the plateform after 2015. The current usage metrics is available 48-96 hours after online publication and is updated daily on week days.
Initial download of the metrics may take a while.