Fig. 4
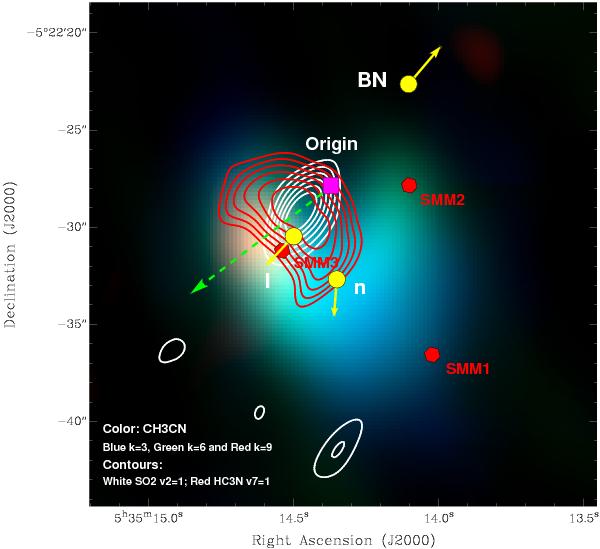
SMA CH3CN(12k–11k) composite image with red representing the rotational transition k = 9, green k = 6, and blue k = 3. Overlaid on this image are HC3N(37−36) (ν7 = 1) and SO2(212,20–211,21)(ν2 = 1) integrated emissions (red and white contours, respectively). The red contours are from 30% to 90% with steps of 12% of the peak of the line emission (170 Jy beam-1 km s-1). The integrated velocity range of the HC3N(37−36)(ν7 = 1) line emission is from − 12 to + 19 km s-1. The white contours are from 40% to 90% with steps of 5% of the peak of the integrated emission (35.1 Jy beam-1 km s-1). The integrated velocity range of the SO2(212,20–211,21) (ν2 = 1) line emission is from − 1 to + 13 km s-1. The yellow circles with vectors mark the same positions as in Figs. 3 and 4, the pink square represents the origin of the Orion KL molecular outflow as suggested by our SMA CO(2 − 1) observations. The red hexagons mark the positions of the three submillimeter sources SMM1, SMM2, and SMM3, the green dashed arrow the position and orientation of the filament structure revealed by the moment two map of HC3N(37 − 36)(ν7 = 1), see Fig. 5.
Current usage metrics show cumulative count of Article Views (full-text article views including HTML views, PDF and ePub downloads, according to the available data) and Abstracts Views on Vision4Press platform.
Data correspond to usage on the plateform after 2015. The current usage metrics is available 48-96 hours after online publication and is updated daily on week days.
Initial download of the metrics may take a while.