Fig. 3
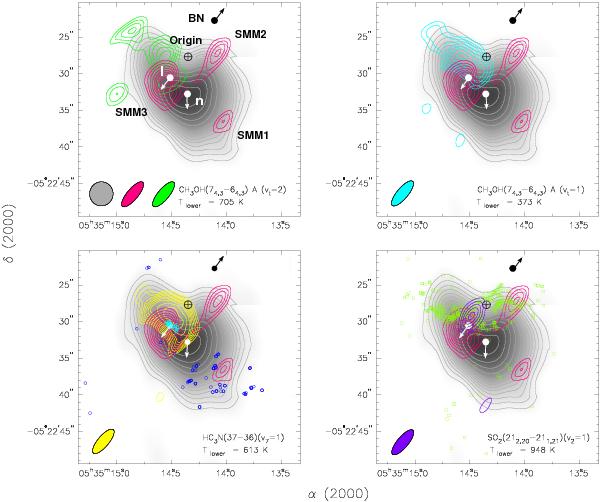
Overlays of the SMA 870 μm continuum map (pink contours) and the integrated line emission maps of four submillimeter tosionally/vibrationally excited lines towards the Orion BN-KL region onto the CH3CN(123–113) integrated line emission map (grey). The pink contours are from 40% to 90% with steps of 5% the peak of the continuum emission, 4.5 Jy beam-1. The grey contours are −2, 2, 3, 4, 5, 6, 7, 8, 9, 10, 12, 14, 16, 18, and 20 times 30 Jy beam-1 km s-1, the rms noise of the image. Upper left panel: CH3OH(74,3–64,3) A− (νt = 2): green contours. The contours are from 35% to 90% with steps of 10% of the peak of the line emission, 37 Jy beam-1 km s-1. Upper right panel: CH3OH(74,3–64,3) A− (νt = 1) (blue contours). The contours are from 35% to 90% with steps of 10% of the peak of the line emission, 50 Jy beam-1 km s-1. Lower left panel: HC3N(37 − 36)(ν7 = 1) (yellow contours). The contours are from 20% to 90% with steps of 10% the peak of the line emission, 170 Jy beam-1 km s-1. Lower right panel: SO2(212,20–211,21)(ν2 = 1) (purple contours). The contours are from 40% to 90% with steps of 5% the peak of the integrated emission, 35.1 Jy beam-1 km s-1. In every panel, the black and white circles with vectors mark the position and the orientation of the proper motions of the radio and infrared sources BN, I, and n. The black open circle with a cross represents the zone from which the three sources were ejected some 500 years ago and that is the origin of the Orion-KL molecular outflow as suggested by the SMA CO(2 − 1) observations. The synthesized beams of the SMA millimeter and submillimeter observations are shown in the bottom left hand part of each panel. The blue open circles and green squares mark the positions of the H2O and OH maser spots, respectively (Gaume et al. 1998; Cohen et al. 2006). The light blue open circles show the water masers close to source I.
Current usage metrics show cumulative count of Article Views (full-text article views including HTML views, PDF and ePub downloads, according to the available data) and Abstracts Views on Vision4Press platform.
Data correspond to usage on the plateform after 2015. The current usage metrics is available 48-96 hours after online publication and is updated daily on week days.
Initial download of the metrics may take a while.