Fig. 1
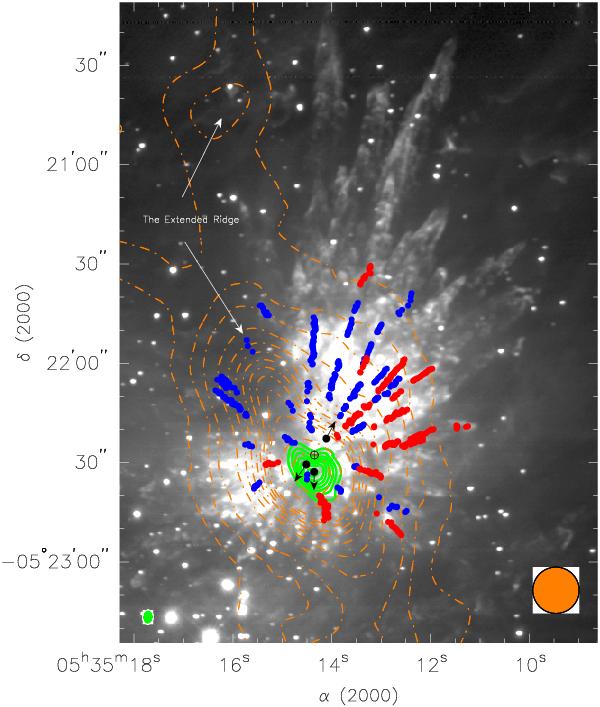
H2 image of the Orion KL region (Bally et al., in prep.) overlaid with an integrated intensity SMA map of CH3CN(123–113) (green contours), the positions of the blueshifted and redshifted CO(2 − 1) fingers from Zapata et al. (2009) (blue and red dots, respectively) and a SCUBA 850 μm continuum map from Johnstone & Bally (1999) (brown dashed contours). The green contours are −2, 2, 4, 6, 8, 10, 12, 14, 16, 18, and 20 times 30 Jy beam-1 km s-1, the rms noise of the image. The brown dashed contours are −2, 2, 4, 6, 8, 10, 12, 14, 16, 18, and 20 times 3.5 Jy beam-1. The black circles with vectors mark the positions and orientations of the proper motions of the radio and infrared sources BN, I and n (Rodríguez et al. 2005; Gómez et al. 2005). The black open circle with a cross represents the zone from where the three sources were ejected some 500 years ago, and the origin of the Orion KL molecular outflow as suggested by SMA CO(2 − 1) observations (Gómez et al. 2005; Zapata et al. 2009). The beam size of the SMA CH3CN(123–113) and the SCUBA maps are shown at the left- and right-hand bottom, respectively. The synthesized beam size of the SMA is 3.′′28 × 3.′′12 with a PA = −14.0°. The beam size of the SCUBA submillimeter observations is about 14′′.
Current usage metrics show cumulative count of Article Views (full-text article views including HTML views, PDF and ePub downloads, according to the available data) and Abstracts Views on Vision4Press platform.
Data correspond to usage on the plateform after 2015. The current usage metrics is available 48-96 hours after online publication and is updated daily on week days.
Initial download of the metrics may take a while.