Fig. 2
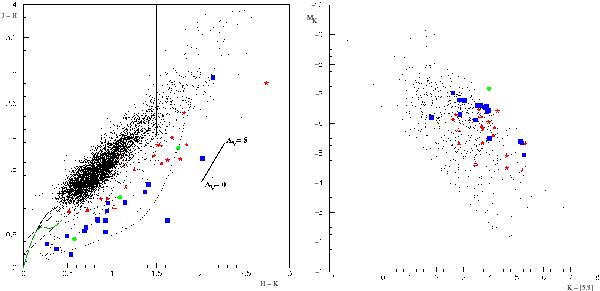
Left: J − H versus H − K colour diagram. The dot points represent all objects selected with the mid-infrared selection criteria. All the new and known Magellanic and Galactic bulge RCB stars are represented; their symbols are identical to those in Fig. 1. The dotted curve corresponds to the combination of black bodies consisting of a 5500 K star and a 1000 K dust shell in various proportions ranging from all “star” to all “shell” (from Feast 1997). The straight lines delimit the near-infrared selection area (see Eqs. (1) and (2)). The line on the right side represents the reddening vector of Rieke & Lebofsky (1985). Also shown are the expected positions (lines in the bottom-left side) of common dwarf (green) and giant (black) stars from Bessell & Brett (1988). Right: CMD absolute magnitude MK versus K − [5.8] of all objects that passed the two infrared selection criteria.
Current usage metrics show cumulative count of Article Views (full-text article views including HTML views, PDF and ePub downloads, according to the available data) and Abstracts Views on Vision4Press platform.
Data correspond to usage on the plateform after 2015. The current usage metrics is available 48-96 hours after online publication and is updated daily on week days.
Initial download of the metrics may take a while.