Fig. 5
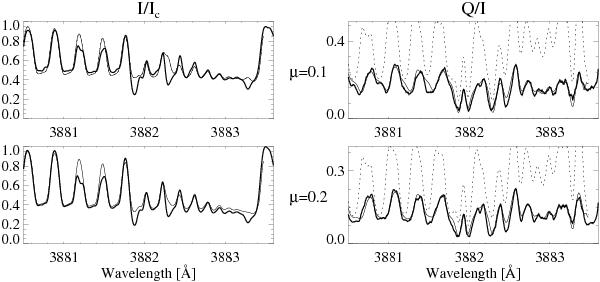
Observations of Stokes I/ Ic and Q/ I in the region of the (0, 0) bandhead and fits obtained with the FALC atmosphere model and increased anisotropy. The three curves presented in each panel correspond to observations (thick solid) and to the calculations with zero magnetic field (dotted) and with a magnetic field strength of 82 G (thin solid). Note that no differences between the calculated curves are apparent in intensity.
Current usage metrics show cumulative count of Article Views (full-text article views including HTML views, PDF and ePub downloads, according to the available data) and Abstracts Views on Vision4Press platform.
Data correspond to usage on the plateform after 2015. The current usage metrics is available 48-96 hours after online publication and is updated daily on week days.
Initial download of the metrics may take a while.