Fig. 3
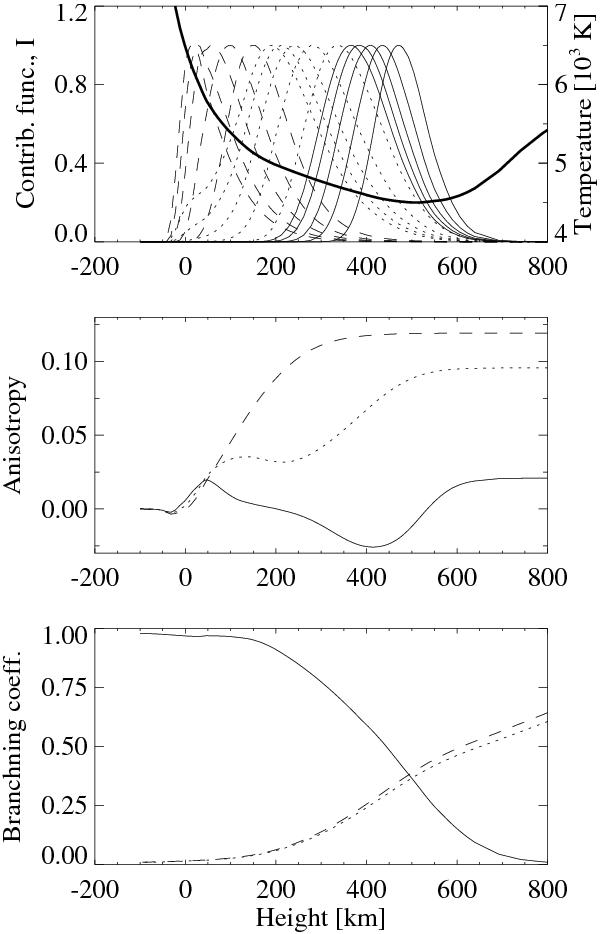
Upper and middle panels: normalized contribution functions of
Stokes I as well as the anisotropy at 3871.2 Å in the
(1, 1) bandhead (thin solid lines), at 3869.1 Å in a CN blend (dotted lines) and at
the local continuum (dashed lines). The contribution functions are given for five
μ values: from 0.1 (rightmost) to 0.5 (leftmost). The FALC
temperature as a function of height is given in the upper panel
(thick solid line, right scale). Lower panel: branching
coefficients for the source function of P1(14)
(3869.1 Å) line: thermal (solid line), Raman (dotted line) and Rayleigh (dashed
line). Assumed  value
is 0.3.
value
is 0.3.
Current usage metrics show cumulative count of Article Views (full-text article views including HTML views, PDF and ePub downloads, according to the available data) and Abstracts Views on Vision4Press platform.
Data correspond to usage on the plateform after 2015. The current usage metrics is available 48-96 hours after online publication and is updated daily on week days.
Initial download of the metrics may take a while.