Fig. 2
 and
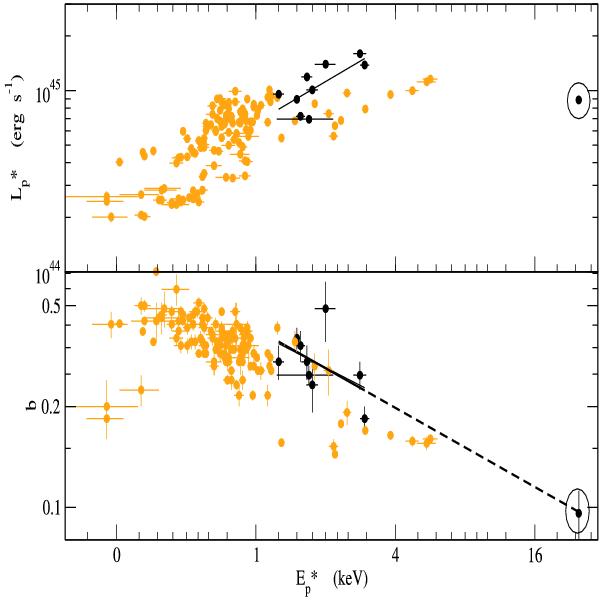
and  plots for 1H 1426+428 (black filled squares) compared with those of Mrk 421 (orange circles). Black lines indicate the regressions underlying the rlog correlation coefficient. Circled values refers to the peculiar observation performed on the 16 June 2001 by XMM-Newton (see Massaro et al. 2008, A&A, 478, 395, for more details).
Current usage metrics show cumulative count of Article Views (full-text article views including HTML views, PDF and ePub downloads, according to the available data) and Abstracts Views on Vision4Press platform.
Data correspond to usage on the plateform after 2015. The current usage metrics is available 48-96 hours after online publication and is updated daily on week days.
Initial download of the metrics may take a while.