Fig. 4
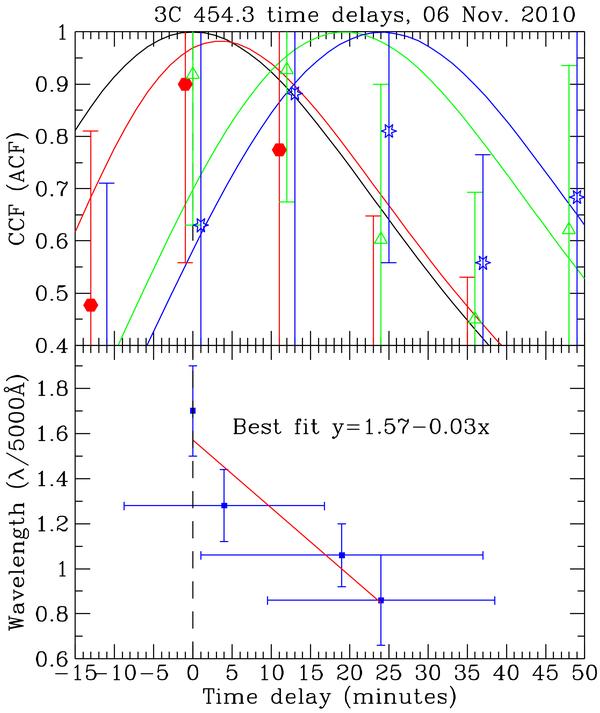
The cross-correlation functions used to determine the time lags during the monitoring of 06 Nov. 2010 (the upper panel). CCFs, applied to the fitting polynomials are in red, yellow, green and blue, green, red and black (from right to left) for the BVRI filters, respectively (for I-band the auto-correlation function is shown). As an additional check, the discrete cross-correlation function (DCCF) applied to the real data is also shown with the corresponding errors (filled circles, open triangles, and stars for the RVB bands respectively) and seems to indicate consistency within the errors. The lower panel shows the relation between the wavelength of the filter (with the corresponding error based on its transparency curve) and the time lag with respect to the I-band. MC simulations are used to assess the errors of the time lags, see the text. A positive lag indicates a delay behind the I-band.
Current usage metrics show cumulative count of Article Views (full-text article views including HTML views, PDF and ePub downloads, according to the available data) and Abstracts Views on Vision4Press platform.
Data correspond to usage on the plateform after 2015. The current usage metrics is available 48-96 hours after online publication and is updated daily on week days.
Initial download of the metrics may take a while.