Fig. 2
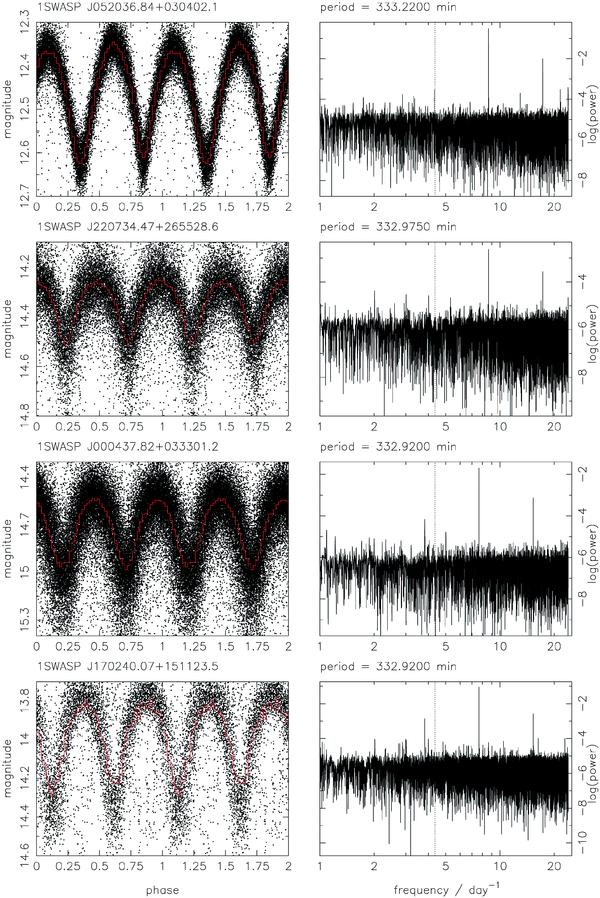
(Left) SuperWASP light curves folded at the orbital period, in order of decreasing period. Phase zero corresponds to 2004 January 1st 00:00UT in each case. The mean folded light curve (in 50 bins) is shown by an over-plotted line. (Right) The associated power spectra, with the frequency corresponding to the presumed orbital period indicated by a dotted line. The SuperWASP identifier and the presumed orbital period are written above each pair of panels.
Current usage metrics show cumulative count of Article Views (full-text article views including HTML views, PDF and ePub downloads, according to the available data) and Abstracts Views on Vision4Press platform.
Data correspond to usage on the plateform after 2015. The current usage metrics is available 48-96 hours after online publication and is updated daily on week days.
Initial download of the metrics may take a while.