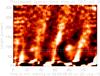
Fig. 2
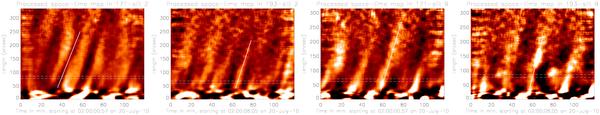
Space-time maps with time on X-axis, constructed from slits 2 and 9 (See Fig. 1) and processed, in two coronal channels of AIA, 171 Å and 193 Å. First two panels are for slit 2 (plume) and the last two are for slit 9 (interplume). The slanted solid line, marked in each panel, following the ridges is used for the propagation speed estimation. The horizontal dotted lines in each of these, enclose the rows averaged for wavelet analysis. Corresponding maps in 211 Å are shown in Fig. 4.
Current usage metrics show cumulative count of Article Views (full-text article views including HTML views, PDF and ePub downloads, according to the available data) and Abstracts Views on Vision4Press platform.
Data correspond to usage on the plateform after 2015. The current usage metrics is available 48-96 hours after online publication and is updated daily on week days.
Initial download of the metrics may take a while.