Fig. 1
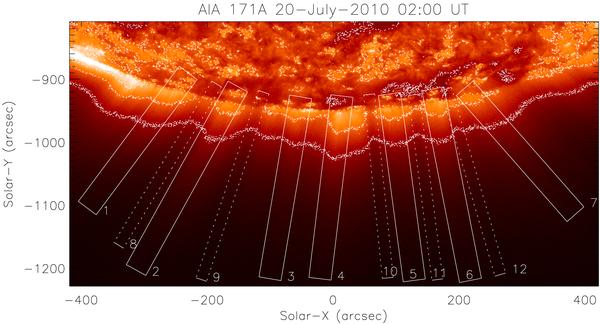
South polar region of the Sun as seen by AIA/SDO through one of its EUV channels centered at 171 Å. This snapshot is taken at 02:00 UT on 20 July 2010. Overplotted dotted curves are the contours of three different intensity levels indicating clear plume and interplume structures. The rectangular boxes delineate the locations of artificial slits extracted for the analysis, following intensity contours. Slits over plume regions are 60 pixels (≈36″) wide and those over interplume regions are 30 pixels (≈18″) wide. These are marked differently using solid lines for plume locations and dotted lines for interplume locations. Slit numbers are labeled at the bottom right of each slit. The movies show the temporal evolution as seen in the 171 Å, 193 Å, and 211 Å channels.
Current usage metrics show cumulative count of Article Views (full-text article views including HTML views, PDF and ePub downloads, according to the available data) and Abstracts Views on Vision4Press platform.
Data correspond to usage on the plateform after 2015. The current usage metrics is available 48-96 hours after online publication and is updated daily on week days.
Initial download of the metrics may take a while.