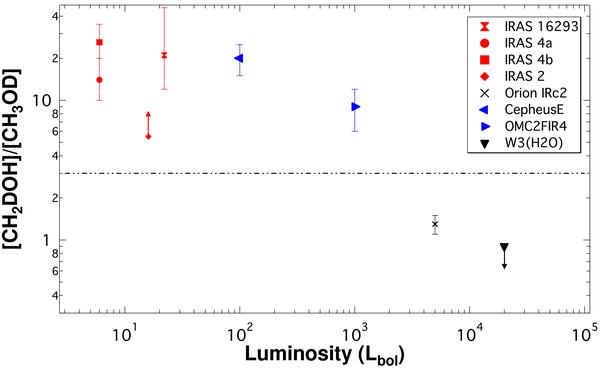
Fig. 2

[CH2DOH]/[CH3OD] ratio as a function of the protostar luminosity. Low-mass data (IRAS 16293, IRAS 4a, IRAS 4b and IRAS 2) were taken from Parise et al. (2006), while the data for Orion IRc2 is from Jacq et al. (1993). The upper limit reported in Table 1 for G24.78+0.08 is not plotted because of the uncertain identification of the CH3OD line at 133.9254 GHz. The horizontal dashed line refers to the value predicted by grain chemistry models (Charnley et al. 1997).
Current usage metrics show cumulative count of Article Views (full-text article views including HTML views, PDF and ePub downloads, according to the available data) and Abstracts Views on Vision4Press platform.
Data correspond to usage on the plateform after 2015. The current usage metrics is available 48-96 hours after online publication and is updated daily on week days.
Initial download of the metrics may take a while.


