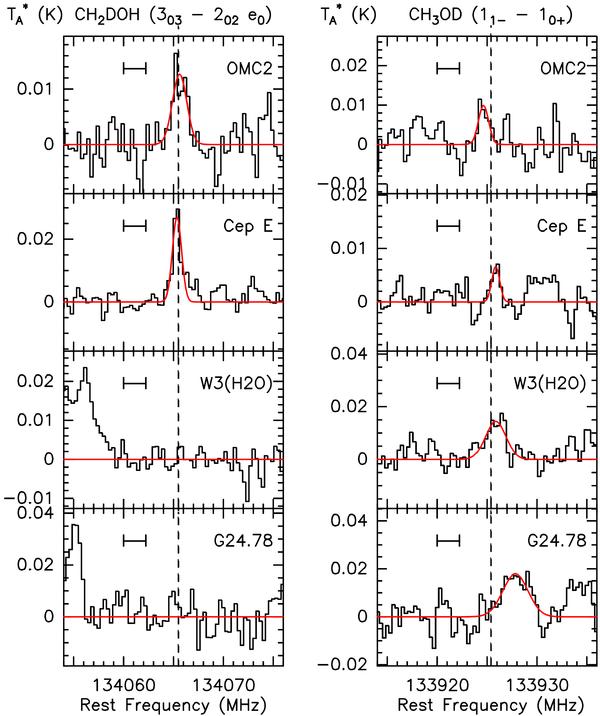
Fig. 1

CH2DOH and CH3OD spectra towards the four sources. The observed positions and the assumed vLSR rest velocities are the following: OMC2 FIR4 (05:35:26.7, –05:09:59), 10.5 km s-1; CepheusE (23:03:12.7, +61:42:27), –11.4 km s-1; W3(H2O) (02:27:04.6, +61:52:26), –48.0 km s-1; G24.78+0.08 (18:36:12.6, −07:12:11), 111.0 km s-1. The line intensities are expressed in antenna temperature scale. The curves are Gaussian fits to the detected lines and the dashed lines indicate the expected frequencies of the lines. The small horizontal segment has a width of 5 km s-1. The broad feature right to the CH3OD line in Cep E includes the CH2DOH line (321−220 e1) at 133930.2 GHz. The CH3OD line in G24.78+0.08 appears at a significantly velocity shift so that its identification must be considered as uncertain.
Current usage metrics show cumulative count of Article Views (full-text article views including HTML views, PDF and ePub downloads, according to the available data) and Abstracts Views on Vision4Press platform.
Data correspond to usage on the plateform after 2015. The current usage metrics is available 48-96 hours after online publication and is updated daily on week days.
Initial download of the metrics may take a while.


