Fig. 9
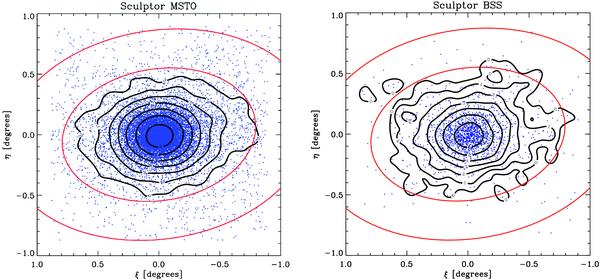
Contour maps of the MSTO and BSS populations overlaid on the individual stars, shown as dots. The outer (red) ellipse is the tidal radius of the galaxy. The inner (red) ellipse is the largest ellipse not influenced by contour deformation caused by the proximity of the edge of observational coverage. The outermost contour in each plot is defined as 1% of the foreground corrected maximum intensity level. Subsequent contour levels increase by a factor 2 for each contour. North is up, and east is to the left.
Current usage metrics show cumulative count of Article Views (full-text article views including HTML views, PDF and ePub downloads, according to the available data) and Abstracts Views on Vision4Press platform.
Data correspond to usage on the plateform after 2015. The current usage metrics is available 48-96 hours after online publication and is updated daily on week days.
Initial download of the metrics may take a while.