Fig. 6
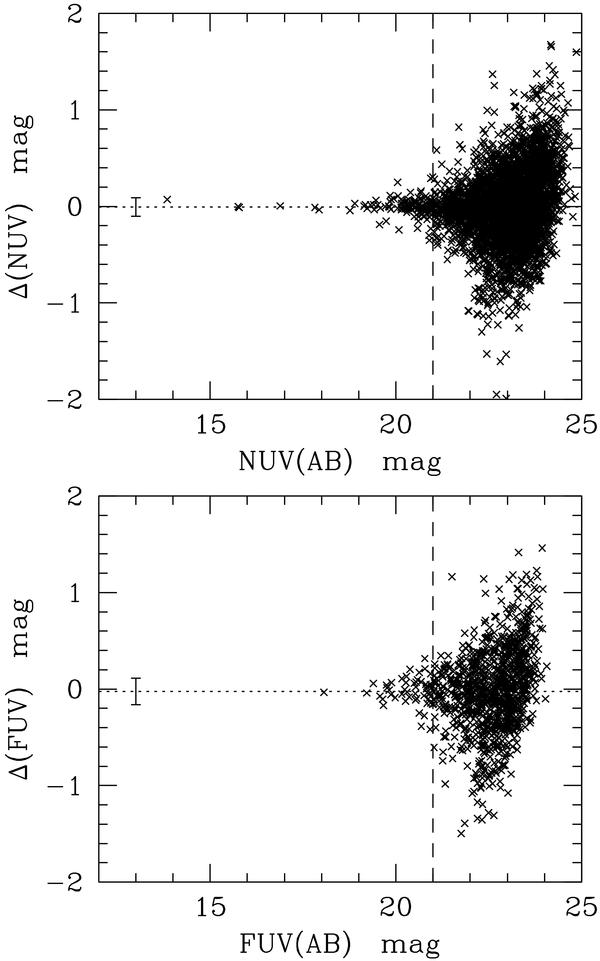
The comparison of NUV (upper panel) and FUV (lower panel) magnitudes obtained form the standard GALEX pipeline for galaxies detected in more than one field. The vertical dashed line indicates the limiting magnitude (21) adopted in this study. The error bar on the left gives the 1σ dispersion in the data, while the horizontal dotted line gives the mean value, both determined for galaxies with < 21 mag.
Current usage metrics show cumulative count of Article Views (full-text article views including HTML views, PDF and ePub downloads, according to the available data) and Abstracts Views on Vision4Press platform.
Data correspond to usage on the plateform after 2015. The current usage metrics is available 48-96 hours after online publication and is updated daily on week days.
Initial download of the metrics may take a while.