Free Access
Fig. 6
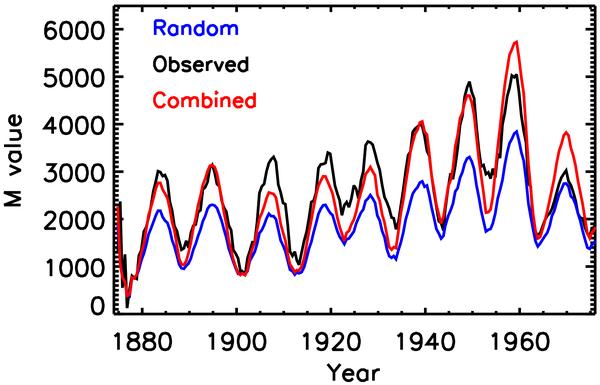
Time evolution of the proxy for the equatorial dipole moment, M, during 1874–1976 for τ = 6 months. The random (blue curve), observed (black curve) and combined (red curve) models for the longitude distribution of sunspot emergence are shown. The value of c = 0.15 corresponds to τ = 6 months.
Current usage metrics show cumulative count of Article Views (full-text article views including HTML views, PDF and ePub downloads, according to the available data) and Abstracts Views on Vision4Press platform.
Data correspond to usage on the plateform after 2015. The current usage metrics is available 48-96 hours after online publication and is updated daily on week days.
Initial download of the metrics may take a while.