Fig. 2
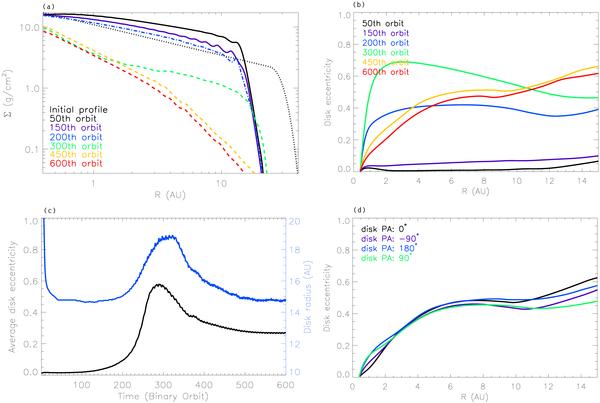
Panel a): evolution of the azimuthally averaged density profile shown in six epochs calculated at 0, 50, 150, 300, 450, and 600th binary orbits. The initial density profile is shown with black dotted curve. Panel b): evolution of the azimuthally averaged eccentricity shown in five curves calculated at 50, 150, 300, 450, and 600th binary orbits. Only the 0−20 AU region is shown in the plot, as the disk is significantly truncated beyond 20 AU. Panel c): evolution of the disk radius (with blue), and the averaged disk eccentricity (with black). The curves are smoothed to remove “noise” (see text for explanation). Panel d): variation in the disk eccentricity during a full disk precession period. The disk position angle (PA) is measured relative to the position of the orbiting secondary.
Current usage metrics show cumulative count of Article Views (full-text article views including HTML views, PDF and ePub downloads, according to the available data) and Abstracts Views on Vision4Press platform.
Data correspond to usage on the plateform after 2015. The current usage metrics is available 48-96 hours after online publication and is updated daily on week days.
Initial download of the metrics may take a while.