Fig. 8
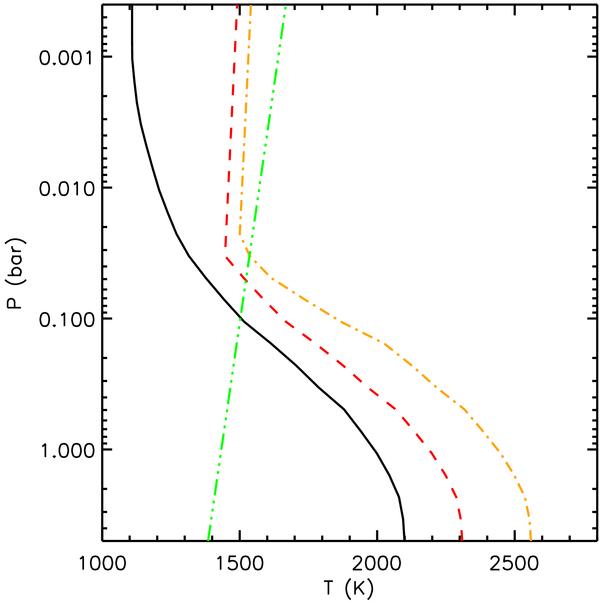
The temperature-pressure (T-P) profile for the our atmospheric models used for modelling the secondary eclipse depth. The black (solid) line shows the uninverted model from Fortney et al. (2008), the green (dashed-triple dotted) line is for a model with an ad hoc temperature inversion as in Todorov et al. (2010), the red (dashed) line shows the temperature pressure profile for an atmosphere with a normal troposphere and an inversion, and the orange (dash-dotted) line is for an atmosphere with Venus-like clouds. The temperatures for the latter profiles are chosen to provide a reasonable fit to the IRAC bands longward of 4 μm.
Current usage metrics show cumulative count of Article Views (full-text article views including HTML views, PDF and ePub downloads, according to the available data) and Abstracts Views on Vision4Press platform.
Data correspond to usage on the plateform after 2015. The current usage metrics is available 48-96 hours after online publication and is updated daily on week days.
Initial download of the metrics may take a while.