Free Access
Fig. 5
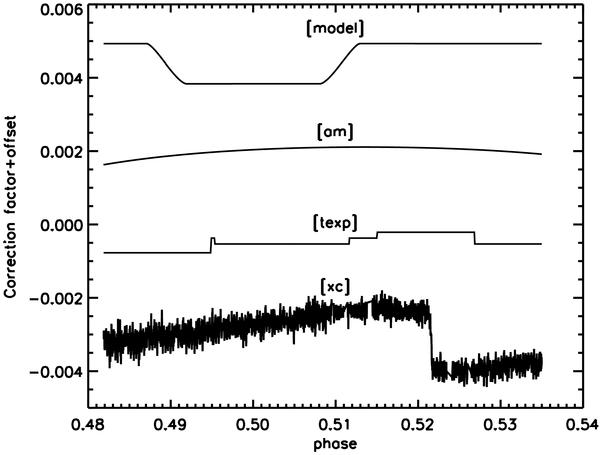
Different components fitted to the lightcurve due to the eclipse and systematic effects. Shown are, from top to bottom the eclipse model, the airmass, the exposure time and the x position on the detector. The different parameters are offset for clarity.
Current usage metrics show cumulative count of Article Views (full-text article views including HTML views, PDF and ePub downloads, according to the available data) and Abstracts Views on Vision4Press platform.
Data correspond to usage on the plateform after 2015. The current usage metrics is available 48-96 hours after online publication and is updated daily on week days.
Initial download of the metrics may take a while.