Fig. 9
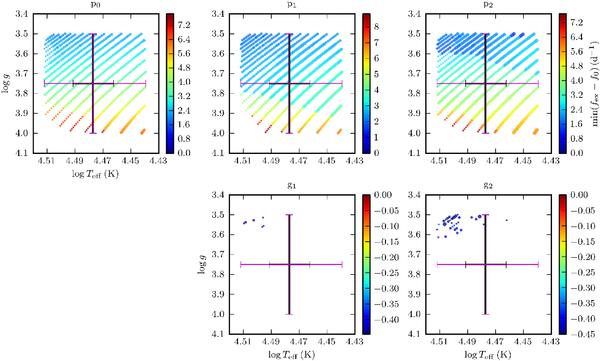
log Teff–log g diagrams showing an overview of models where different modes are predicted to be excited in our non-adiabatic computations for the error box of the components of HD 51756. Each filled circle represents a model along the evolutionary tracks where modes are predicted to be excited. The size of the symbols refers to the number of excited modes (1 − 4 per mode type), while the colour corresponds to the frequency difference between f0 and the closest mode in the model. The spectroscopic parameters and corresponding error estimations of HD 51756 are indicated by thick and thin crosses for the primary and secondary component, respectively.
Current usage metrics show cumulative count of Article Views (full-text article views including HTML views, PDF and ePub downloads, according to the available data) and Abstracts Views on Vision4Press platform.
Data correspond to usage on the plateform after 2015. The current usage metrics is available 48-96 hours after online publication and is updated daily on week days.
Initial download of the metrics may take a while.