Fig. 7
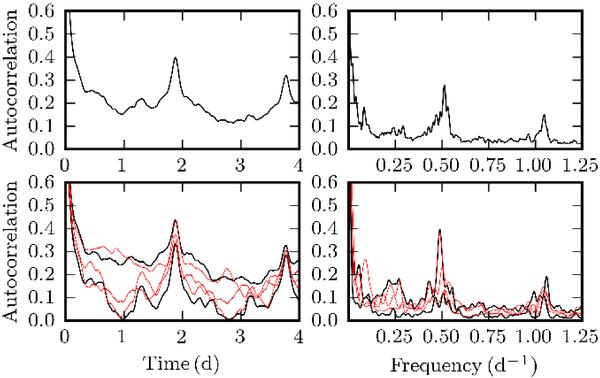
Autocorrelation function of the CoRoT light curve (upper left), of the power spectrum (upper right), of the light curve cut into two and three pieces (lower left), and of the power spectra which were calculated from the pieces (two and three, plotted with thicker and thinner lines, respectively) of the light curve (lower right).
Current usage metrics show cumulative count of Article Views (full-text article views including HTML views, PDF and ePub downloads, according to the available data) and Abstracts Views on Vision4Press platform.
Data correspond to usage on the plateform after 2015. The current usage metrics is available 48-96 hours after online publication and is updated daily on week days.
Initial download of the metrics may take a while.