Free Access
Fig. 6
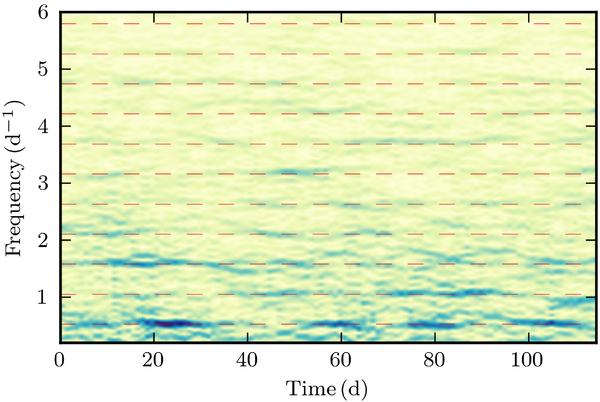
Short-time Fourier transformation (window = 5f0) of the [0.2, 6.0] d-1 region of the light curve, showing that the amplitudes connected to different harmonics of the main peak at f0 = 0.52687 ± 0.00004 d-1 (indicated as red dashed lines) vary significantly over time.
Current usage metrics show cumulative count of Article Views (full-text article views including HTML views, PDF and ePub downloads, according to the available data) and Abstracts Views on Vision4Press platform.
Data correspond to usage on the plateform after 2015. The current usage metrics is available 48-96 hours after online publication and is updated daily on week days.
Initial download of the metrics may take a while.