Fig. 5
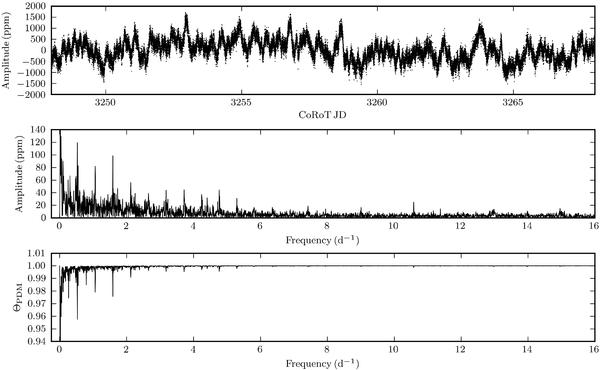
(Upper panel) Part of the reduced CoRoT light curve, showing distinctive sharp recurring features every ≈ 1.9 days. This can be seen easily around 3255 CoRoT JD, where the occurrence of features causing the highest amplitude variations is clearly periodic. (Middle panel) The Scargle periodogram of the full CoRoT light curve showing a series of harmonics at integer multiple frequencies of the main peak at f0 = 0.52687 ± 0.00004 d-1. (Lower panel) ΘPDM-statistics of the light curve, showing the same structure as the Scargle periodogram.
Current usage metrics show cumulative count of Article Views (full-text article views including HTML views, PDF and ePub downloads, according to the available data) and Abstracts Views on Vision4Press platform.
Data correspond to usage on the plateform after 2015. The current usage metrics is available 48-96 hours after online publication and is updated daily on week days.
Initial download of the metrics may take a while.