Fig. 4
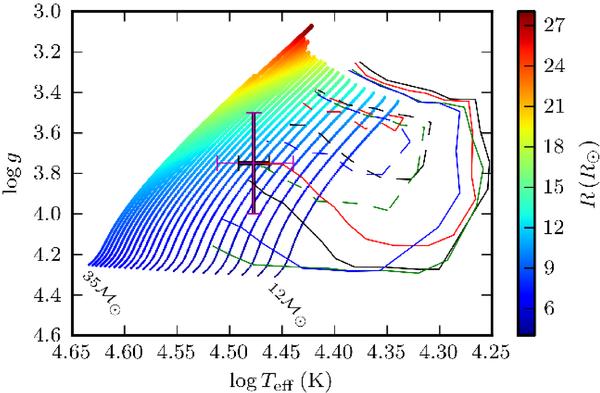
log Teff–log g diagram of late O-type and early B-type stars. The spectroscopic parameters and corresponding error estimations are indicated by thick and thin crosses for the primary and secondary components, respectively. The main sequence evolutionary tracks are for masses of 12 − 35 ℳ⊙ (with a step of 1 ℳ⊙) and a core overshoot parameter αov = 0.2 pressure scale heights, and their shading and thickness indicate the corresponding radius values. Various β Cep instability strips for Z = 0.020 (continuous lines) and Z = 0.010 (dashed lines), both for four different combinations of metal mixtures and opacity computations (OPAL GN93, OP GN93, OPAL AGS05+Ne, and OP AGS05+Ne) are plotted with red, blue, black, and green colours, respectively. These are taken from Miglio et al. (2007), who computed them for masses up to 18 ℳ⊙.
Current usage metrics show cumulative count of Article Views (full-text article views including HTML views, PDF and ePub downloads, according to the available data) and Abstracts Views on Vision4Press platform.
Data correspond to usage on the plateform after 2015. The current usage metrics is available 48-96 hours after online publication and is updated daily on week days.
Initial download of the metrics may take a while.