Free Access
Fig. 3
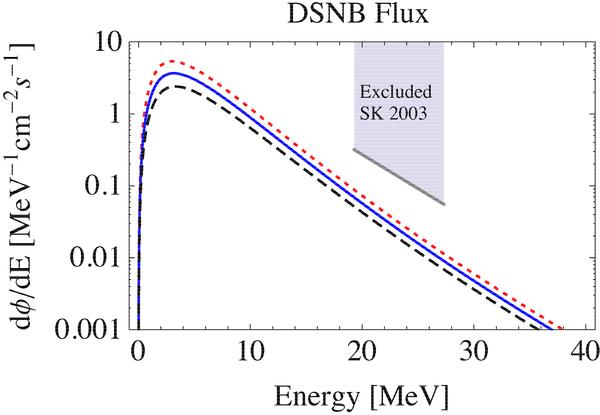
Expected DSNB flux in a logarithmic scale for the three different fits of core-collapse rate. Also is shown the upper limit of this quantity given by Super-Kamiokande in 2003 in the energy range between 19.3 and 27.3 MeV. The meaning of continuous, dotted and dashed lines as in Fig. 2.
Current usage metrics show cumulative count of Article Views (full-text article views including HTML views, PDF and ePub downloads, according to the available data) and Abstracts Views on Vision4Press platform.
Data correspond to usage on the plateform after 2015. The current usage metrics is available 48-96 hours after online publication and is updated daily on week days.
Initial download of the metrics may take a while.