Fig. 12
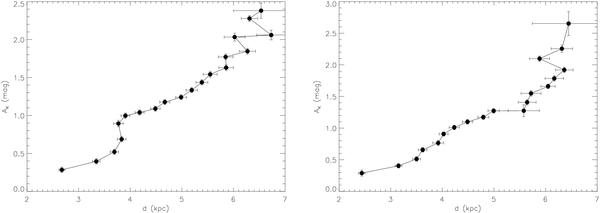
Left panel: run of the extinction in the direction to Alicante 7. The data have been obtained by applying the technique of Cabrera-Lavers et al. (2005) to the red clump giant population within 20′ from the nominal cluster centre. Right panel: same for the field surrounding RSGC3. Both runs are pretty similar. The sudden increase in the reddening at ~ 6 kpc provides a direct estimate on the distance to both clusters.
Current usage metrics show cumulative count of Article Views (full-text article views including HTML views, PDF and ePub downloads, according to the available data) and Abstracts Views on Vision4Press platform.
Data correspond to usage on the plateform after 2015. The current usage metrics is available 48-96 hours after online publication and is updated daily on week days.
Initial download of the metrics may take a while.