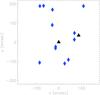
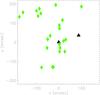
Fig. 5
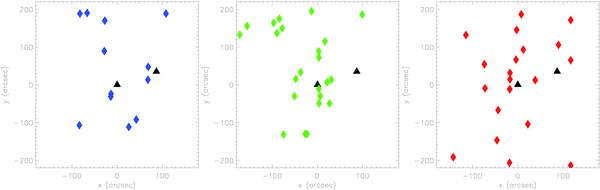
Left panel: spatial distribution of the PNs associated with the blue secondary peak in the PN LOSVD (<2800 km s-1). Central panel: spatial distribution of the PNs associated with the central ICL component (2800 km s-1 to 4450 km s-1). Right panel: spatial distribution of the PNs associated with the secondary red peak at > 4450 km s-1 in the PN LOSVD. The black triangles indicate NGC 3311 (center) and NGC 3309 (north-west of center), respectively. North is up and east is to the left.
Current usage metrics show cumulative count of Article Views (full-text article views including HTML views, PDF and ePub downloads, according to the available data) and Abstracts Views on Vision4Press platform.
Data correspond to usage on the plateform after 2015. The current usage metrics is available 48-96 hours after online publication and is updated daily on week days.
Initial download of the metrics may take a while.