Fig. 3
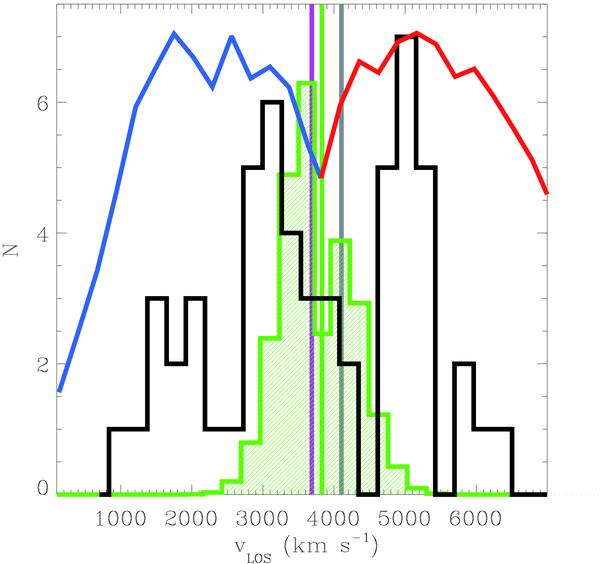
LOSVD for the Hydra I PN sample from Fig. 1 (black histogram), compared with a simulated MSIS LOSVD (green histogram) for a Gaussian velocity distribution with σcore = 464 km s-1; see text for further details. The blue-red solid line shows the combined filter transmission curve as given in Eq. (7). The vertical magenta, green and gray lines mark the systemic velocity of Hydra I, NGC 3311 and NGC 3309, respectively.
Current usage metrics show cumulative count of Article Views (full-text article views including HTML views, PDF and ePub downloads, according to the available data) and Abstracts Views on Vision4Press platform.
Data correspond to usage on the plateform after 2015. The current usage metrics is available 48-96 hours after online publication and is updated daily on week days.
Initial download of the metrics may take a while.