Fig. 1
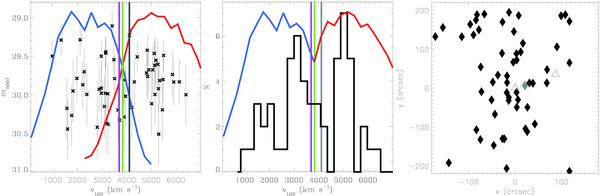
PNs in the Hydra I cluster core. Left panel: the PN velocity-magnitude distribution. The black crosses show the entire sample of 56 PN candidates. The blue and red lines are the measured transmission curves of the blue and the red filter, respectively, normalized so that the maximum transmission is near the theoretical bright cutoff of the PNLF at the distance of Hydra I. Central panel: the PN LOSVD (black histogram). The bins in velocity are 270 km s-1 wide. The blue and the red solid lines show again the suitably normalized transmission curves of the blue and red filters. The vertical magenta, green and gray lines in both panels mark the systemic velocity of Hydra I, NGC 3311 and NGC 3309, respectively. Right panel: spatial distribution of the PNs (black diamonds) in the MSIS field. The field is centered on NGC 3311 and has size ~100 × 100 kpc2; north is up and east to the left. The two open triangles indicate the positions of NGC 3311 (center) and NGC 3309 (upper right). The PN indicated by the gray symbol is the only object compatible with a PN bound to NGC 3309, based on its position on the sky and LOS velocity, vgrayPN = 4422 km s-1.
Current usage metrics show cumulative count of Article Views (full-text article views including HTML views, PDF and ePub downloads, according to the available data) and Abstracts Views on Vision4Press platform.
Data correspond to usage on the plateform after 2015. The current usage metrics is available 48-96 hours after online publication and is updated daily on week days.
Initial download of the metrics may take a while.