Fig. 7
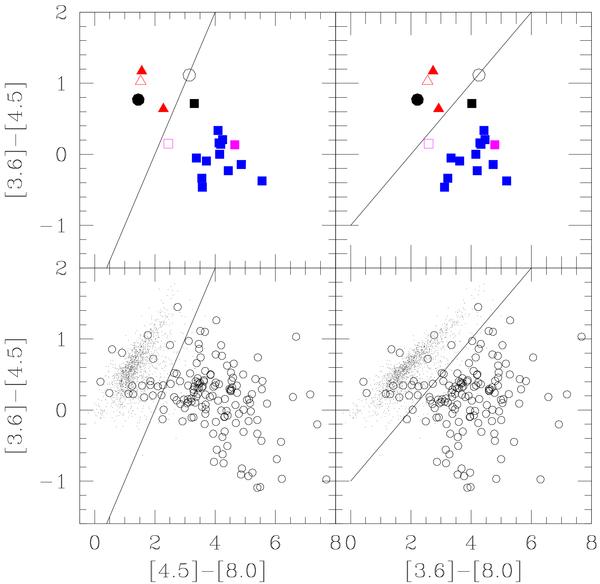
Bottom panels display in the IRAC color–color diagrams the variable stars detected by McQuinn et al. (2007) (small dot symbols) and young HII regions (the open circles; these are sources in the catalog of Verley et al. (2007) with Hα counterpart and not classified as variables). Only 3% of the variable stars lie to the right of the continuous line. In the upper panels we show the same IRAC colors, but for our source sample. Open symbols are sources where no CO was detected, filled symbols are sources with CO detection. Triangles are for variable stars. The open circle is for source 4, with uncertain classification. Squares are for sources from 5 to 19, i.e. HII regions with 24 μm counterparts. The filled dot is for s20, a variable star coincident with an HII region without 24 μm emission.
Current usage metrics show cumulative count of Article Views (full-text article views including HTML views, PDF and ePub downloads, according to the available data) and Abstracts Views on Vision4Press platform.
Data correspond to usage on the plateform after 2015. The current usage metrics is available 48-96 hours after online publication and is updated daily on week days.
Initial download of the metrics may take a while.