Fig. 1
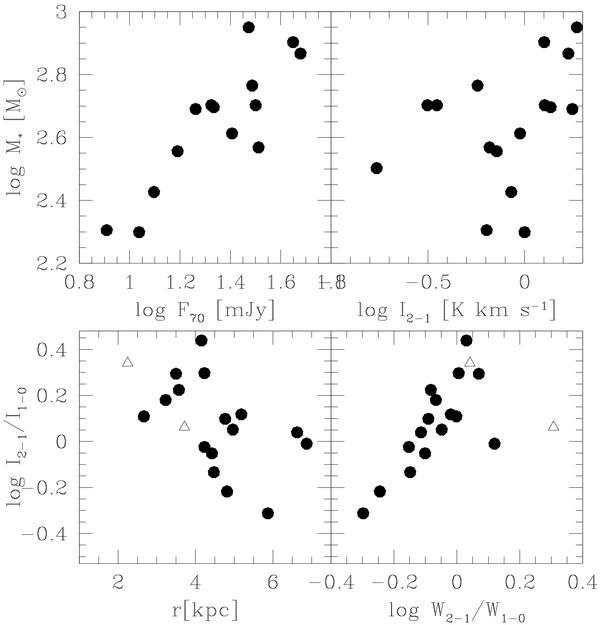
Correlation of F70 and the cluster mass is shown in the upper left panel. The upper right panel shows that clusters of larger mass are associated with brighter CO J = 2–1 lines. The bottom panels display the marginal correlation between the line intensity ratio I2−1/I1−0 and the galactocentric radius and the good correlation between I2−1/I1−0 and the line width ratio W2−1/W1−0. Triangles are for variable stars (s1, s3) and are displayed only in the lower panels.
Current usage metrics show cumulative count of Article Views (full-text article views including HTML views, PDF and ePub downloads, according to the available data) and Abstracts Views on Vision4Press platform.
Data correspond to usage on the plateform after 2015. The current usage metrics is available 48-96 hours after online publication and is updated daily on week days.
Initial download of the metrics may take a while.