Free Access
Fig. 9
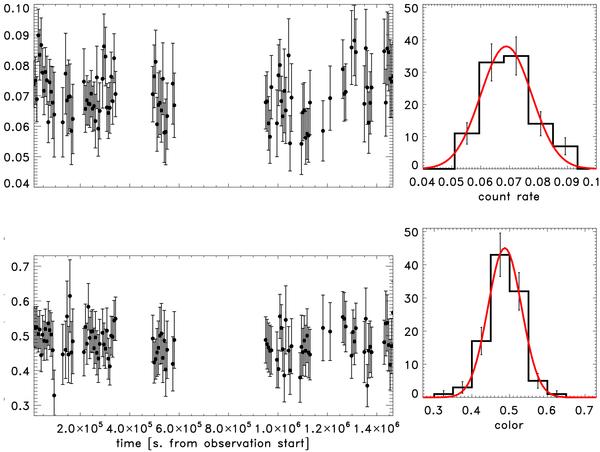
The light (upper-left panel) and color (lower-left) curve of the unresolved signal in the SWJ1557+35 observations. In the right panels we plot the corresponding distribution together with the Gaussian fit. The observed scatter can be completely ascribed to the statistical error of the measurements.
Current usage metrics show cumulative count of Article Views (full-text article views including HTML views, PDF and ePub downloads, according to the available data) and Abstracts Views on Vision4Press platform.
Data correspond to usage on the plateform after 2015. The current usage metrics is available 48-96 hours after online publication and is updated daily on week days.
Initial download of the metrics may take a while.