Fig. 6
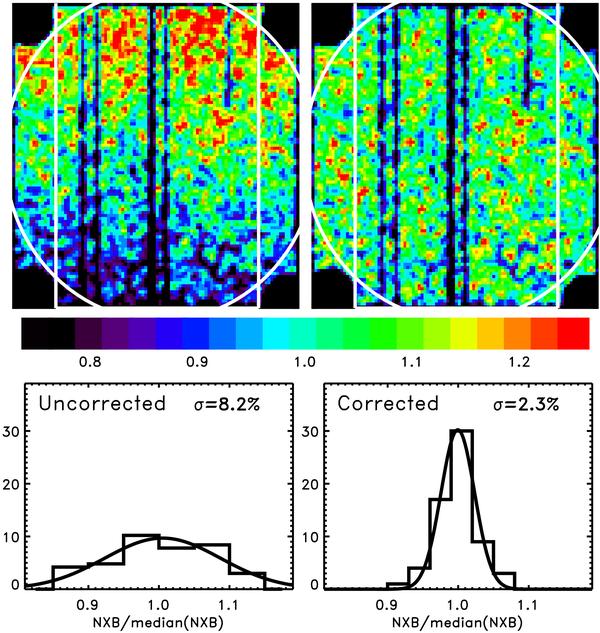
Upper-left: the CCD map in the 7.0−10.0 keV energy band from 6.3 Ms of BFs, normalized to the central raw to show the NXB vertical gradient; Lower-left: the residual distribution calculated in 50 × 50 pixel cells. Upper-right: the CCD map in the 7.0−10.0 keV energy band from 6.3 Ms of BFs, normalized to the central raw to show the NXB vertical gradient, corrected by the linear approximation. Lower-left: the residual distribution calculated in 50 × 50 pixel cells with the linear gradient correction applied.
Current usage metrics show cumulative count of Article Views (full-text article views including HTML views, PDF and ePub downloads, according to the available data) and Abstracts Views on Vision4Press platform.
Data correspond to usage on the plateform after 2015. The current usage metrics is available 48-96 hours after online publication and is updated daily on week days.
Initial download of the metrics may take a while.