Fig. 5
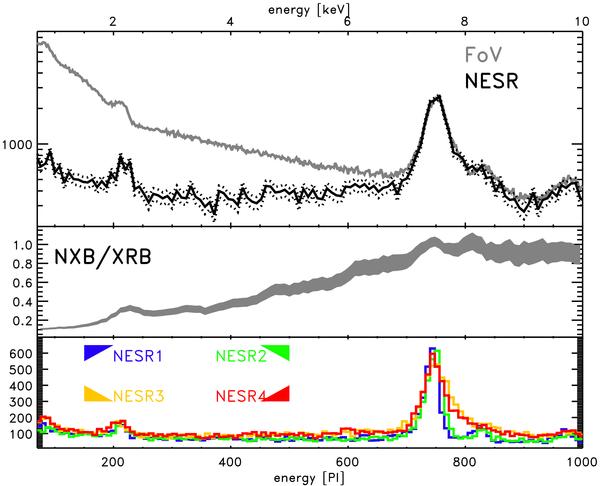
Upper panel: the raw spectrum (P.I. channel distribution; 1 PI ~ 10 eV) of a large number of blank fields (BF, in grey) compared with the spectrum registered in the NESR regions in black. Middle panel: the ratio NESR/BF gives the relative importance of the NXB as function of energy in absence of bright sources. Bottom panel: the 4 NESR spectra show not negligible differences.
Current usage metrics show cumulative count of Article Views (full-text article views including HTML views, PDF and ePub downloads, according to the available data) and Abstracts Views on Vision4Press platform.
Data correspond to usage on the plateform after 2015. The current usage metrics is available 48-96 hours after online publication and is updated daily on week days.
Initial download of the metrics may take a while.