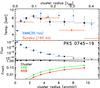
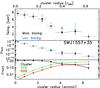
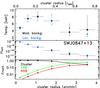
Fig. 2
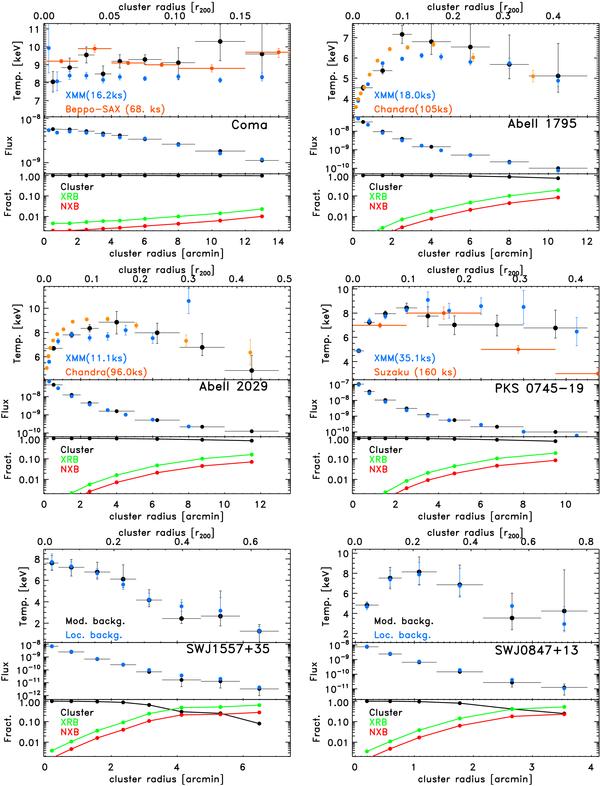
Upper panels: the projected temperature profiles of the six clusters of our sample. For the first four objects, Swift XRT measurements (black points) are compared with XMM-Newton (blue points) Snowden et al. (2008). In the Coma plot we also report the BeppoSAX numbers from De Grandi & Molendi (2002). In the Abell 2029 and Abell 1795 plots we report the Chandra measurements from Vikhlinin et al. (2006). In the PKS0745-19 we report the Suzaku points (George et al. 2009). In the case of SWJ1557+35 and SWJ0847+13 we compare measurements obtained with locally evaluated and modeled background. Middle panels: fluxes in the 0.3−10. keV band in cgs deg-2 units compared with XMM-Newton values from Snowden et al. (2008), in the first four cases, and with the value after local background subtraction in the remaining two. Lower panels: for each extraction region we plot the relative value of the 0.5−2.0 keV band flux for the cluster (black), XRB (green) and NXB (red).
Current usage metrics show cumulative count of Article Views (full-text article views including HTML views, PDF and ePub downloads, according to the available data) and Abstracts Views on Vision4Press platform.
Data correspond to usage on the plateform after 2015. The current usage metrics is available 48-96 hours after online publication and is updated daily on week days.
Initial download of the metrics may take a while.