Fig. 12
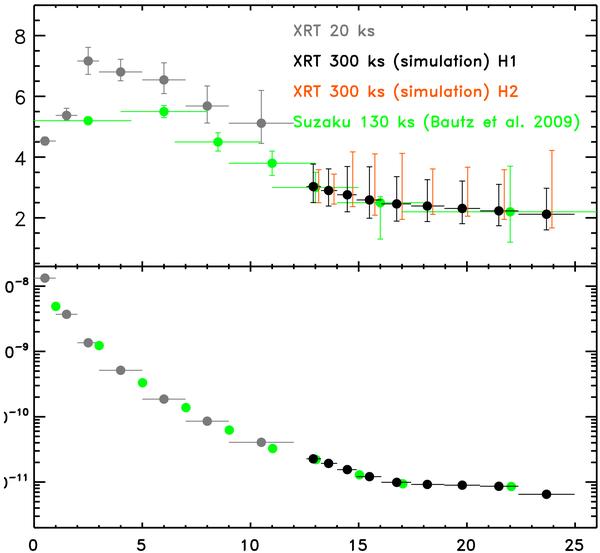
Simulation of 300 ks observation of the northern skirt of Abell 1795. Upper panel: surface brightness of the cluster. Green points are from Suzaku observation (Bautz et al. 2009). Grey points are from Swift XRT observation (already shown in Fig. 2). Black points would be the result of 300 ks observation. Lower panel: the surface brightness profile of the cluster as observed by Suzaku, with the same color code. XRT spatial bins in the simulation are chosen in order to have a minimum of 1000 source counts in the 0.7−2.0 keV band.
Current usage metrics show cumulative count of Article Views (full-text article views including HTML views, PDF and ePub downloads, according to the available data) and Abstracts Views on Vision4Press platform.
Data correspond to usage on the plateform after 2015. The current usage metrics is available 48-96 hours after online publication and is updated daily on week days.
Initial download of the metrics may take a while.