Fig. 11
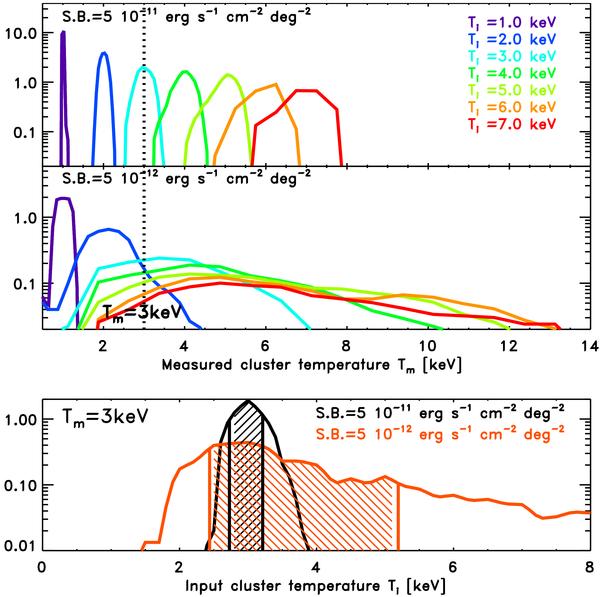
Upper panel: the simulation outputs relative to an APEC spectrum with kT = 1−7 keV 100 ks observation extracted from a region size of 0.5 the field of view in a high signal to background ratio regime (SB = 5 × 10-11 erg s-1 cm-2 deg-2). Different colors indicate the distribution of the results of the fits of different input temperatures (200 realizations each). Middle panel: the same of the upper panel in the case of low signal to background ratio (SB = 5 × 10-12 erg s-1 cm-2 deg-2). Lower panel: the distribution of the Ti scatter values measured at Tm = 3 keV relative to the two different values of surface brightness; the intervals between 16th and 84th percentile of both distributions are in evidence.
Current usage metrics show cumulative count of Article Views (full-text article views including HTML views, PDF and ePub downloads, according to the available data) and Abstracts Views on Vision4Press platform.
Data correspond to usage on the plateform after 2015. The current usage metrics is available 48-96 hours after online publication and is updated daily on week days.
Initial download of the metrics may take a while.