Free Access
Fig. 10
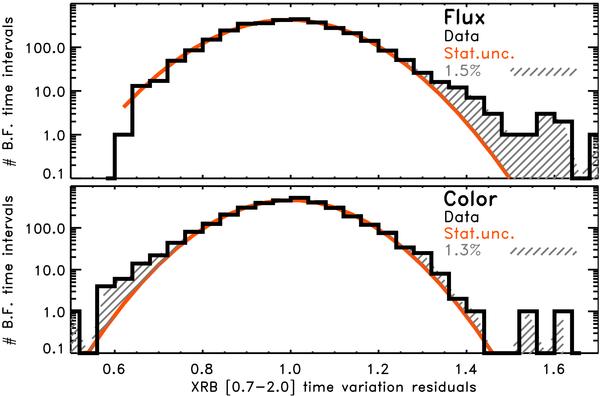
The residual distribution of the flux and color XRB curve of a collection of BFs. We put in evidence the expected Gaussian distribution from statistical uncertainties and the departures from this. We found that only ~1.5% of all the time intervals considered can be considered outliers.
Current usage metrics show cumulative count of Article Views (full-text article views including HTML views, PDF and ePub downloads, according to the available data) and Abstracts Views on Vision4Press platform.
Data correspond to usage on the plateform after 2015. The current usage metrics is available 48-96 hours after online publication and is updated daily on week days.
Initial download of the metrics may take a while.