Fig. A.2
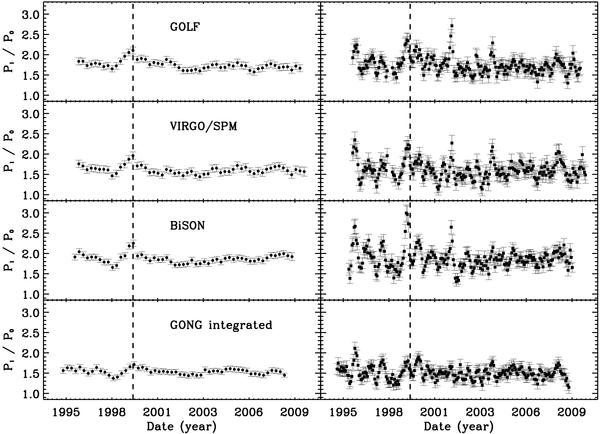
Temporal variations in the l = 1 mode visibilities extracted from the analysis of the non-independent 365-day (left column) and 91.25-day (right column) power spectra of the GOLF, VIRGO/SPM, GONG, and BiSON (from top to bottom) instruments. The vertical dashed lines correspond to 1999 October 10.
Current usage metrics show cumulative count of Article Views (full-text article views including HTML views, PDF and ePub downloads, according to the available data) and Abstracts Views on Vision4Press platform.
Data correspond to usage on the plateform after 2015. The current usage metrics is available 48-96 hours after online publication and is updated daily on week days.
Initial download of the metrics may take a while.