Fig. 15
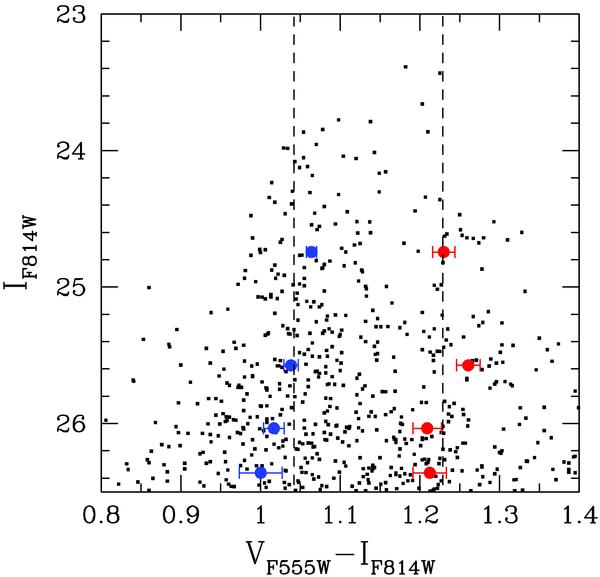
Color–magnitude diagram for 616 globular clusters in the core of A1185 within the range 0.8 ≤ V − I ≤ 1.4 and IF814W ≤ 26.5 mag. The blue and red points indicate the locations of the blue and red peaks determined by KMM fitting of the color distribution in four different luminosity bins to a model with two Gaussian components, as described in the text. Uncertainties in the peak locations were calculated via bootstrap resampling. The dashed lines denote the locations of the blue and red peaks found from KMM analysis for the entire sample of 616 clusters. A correlation between color and magnitude is apparent for the blue globular clusters (dubbed the “blue tilt”) while no such trend is seen for the red clusters.
Current usage metrics show cumulative count of Article Views (full-text article views including HTML views, PDF and ePub downloads, according to the available data) and Abstracts Views on Vision4Press platform.
Data correspond to usage on the plateform after 2015. The current usage metrics is available 48-96 hours after online publication and is updated daily on week days.
Initial download of the metrics may take a while.