Free Access
Fig. 2
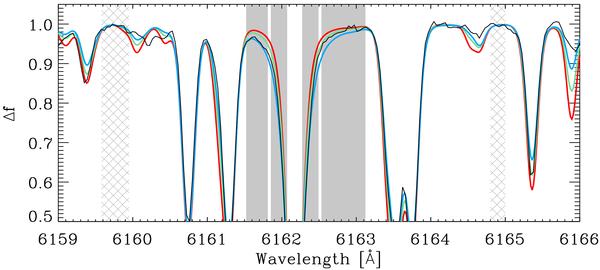
Example of fitting the pressure-sensitive Ca line at 6162 Å in Arcturus (α Boo). Hatched regions are used to normalise the spectrum and χ2 is calculated in the four shaded regions. The best fit is the green line; the red/blue line has log g lower/higher by 0.6 dex.
Current usage metrics show cumulative count of Article Views (full-text article views including HTML views, PDF and ePub downloads, according to the available data) and Abstracts Views on Vision4Press platform.
Data correspond to usage on the plateform after 2015. The current usage metrics is available 48-96 hours after online publication and is updated daily on week days.
Initial download of the metrics may take a while.