Fig. 5
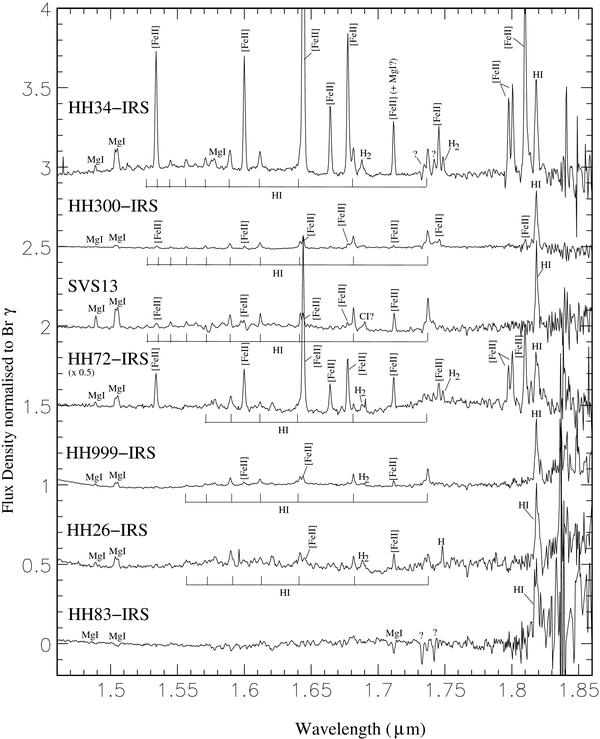
H-band spectra extracted from each target over a 0.5″ square area centred on the continuum peak. The continuum emission has been fitted and removed and the spectra normalised to the peak flux density of Brγ. The spectrum of HH 72-IRS has been scaled by 0.5, and spectra have been separated vertically by a flux density of 0.5, to improve the overall clarity of the figure.
Current usage metrics show cumulative count of Article Views (full-text article views including HTML views, PDF and ePub downloads, according to the available data) and Abstracts Views on Vision4Press platform.
Data correspond to usage on the plateform after 2015. The current usage metrics is available 48-96 hours after online publication and is updated daily on week days.
Initial download of the metrics may take a while.